Explainable AI illuminates the course of history
Analysis shows an enrichment of old concepts through innovations
Understanding the evolution and dissemination of human knowledge over time is a long-cherished dream of many historians. A dream that faced many challenges due to the abundance of historical materials and limited specialist resources. However, the digitization of many historical archives presents new opportunities for AI-supported analysis. Researchers from the Berlin Institute for the Foundations of Learning and Data (BIFOLD) and the Max Planck Institute for the History of Science used machine learning and explainable AI techniques to advance the historical analysis of the “Sacrobosco Collection”. Their findings were now published in Sciences Advances.

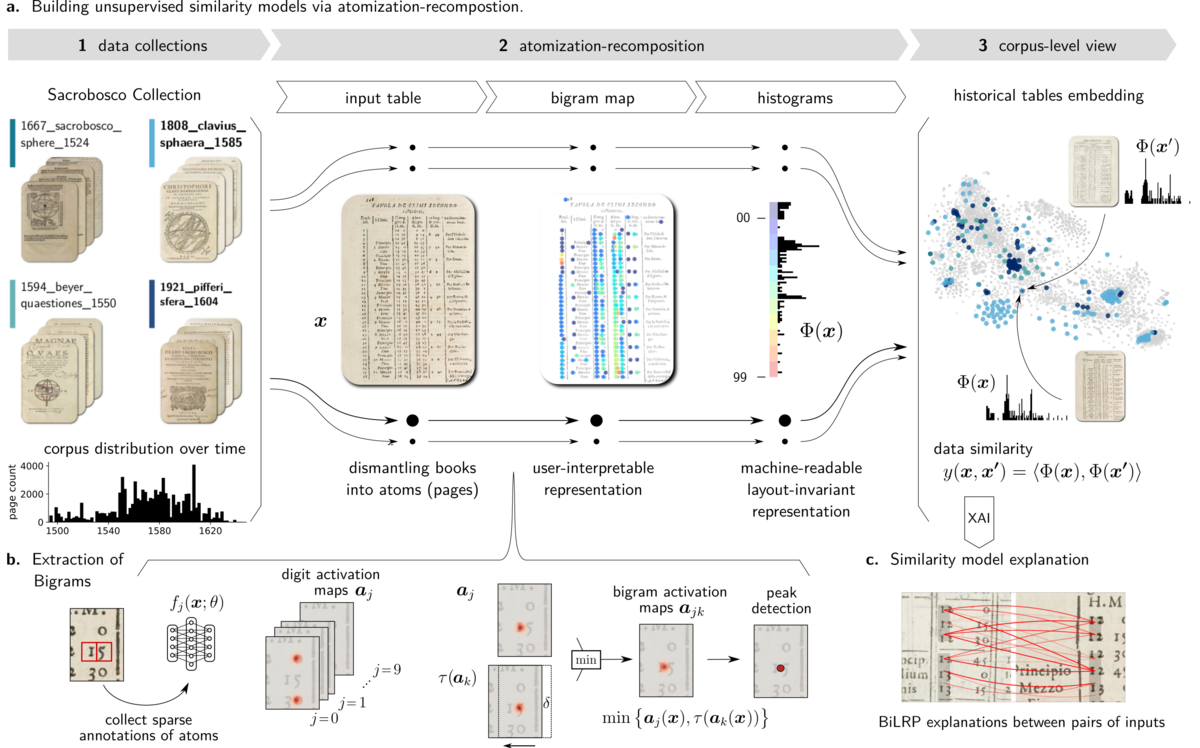
The “Sacrobosco Collection” consists of 359 early modern printed editions of astronomy textbooks from European universities (1472–1650), totaling 76,000 pages. “We developed an unsupervised Machine Learning model, that assists the analysis of historical sources beyond human capacities through our so-called atomization-recomposition approach” explains Matteo Valleriani, professor at the Max Planck Institute for the History of Science and BIFOLD Fellow. “Our analysis uncovers temporal and geographic patterns in knowledge transformation. We highlight the significant role of astronomy textbooks in shaping a unified mathematical culture, driven by competition among educational institutions and market dynamics.”
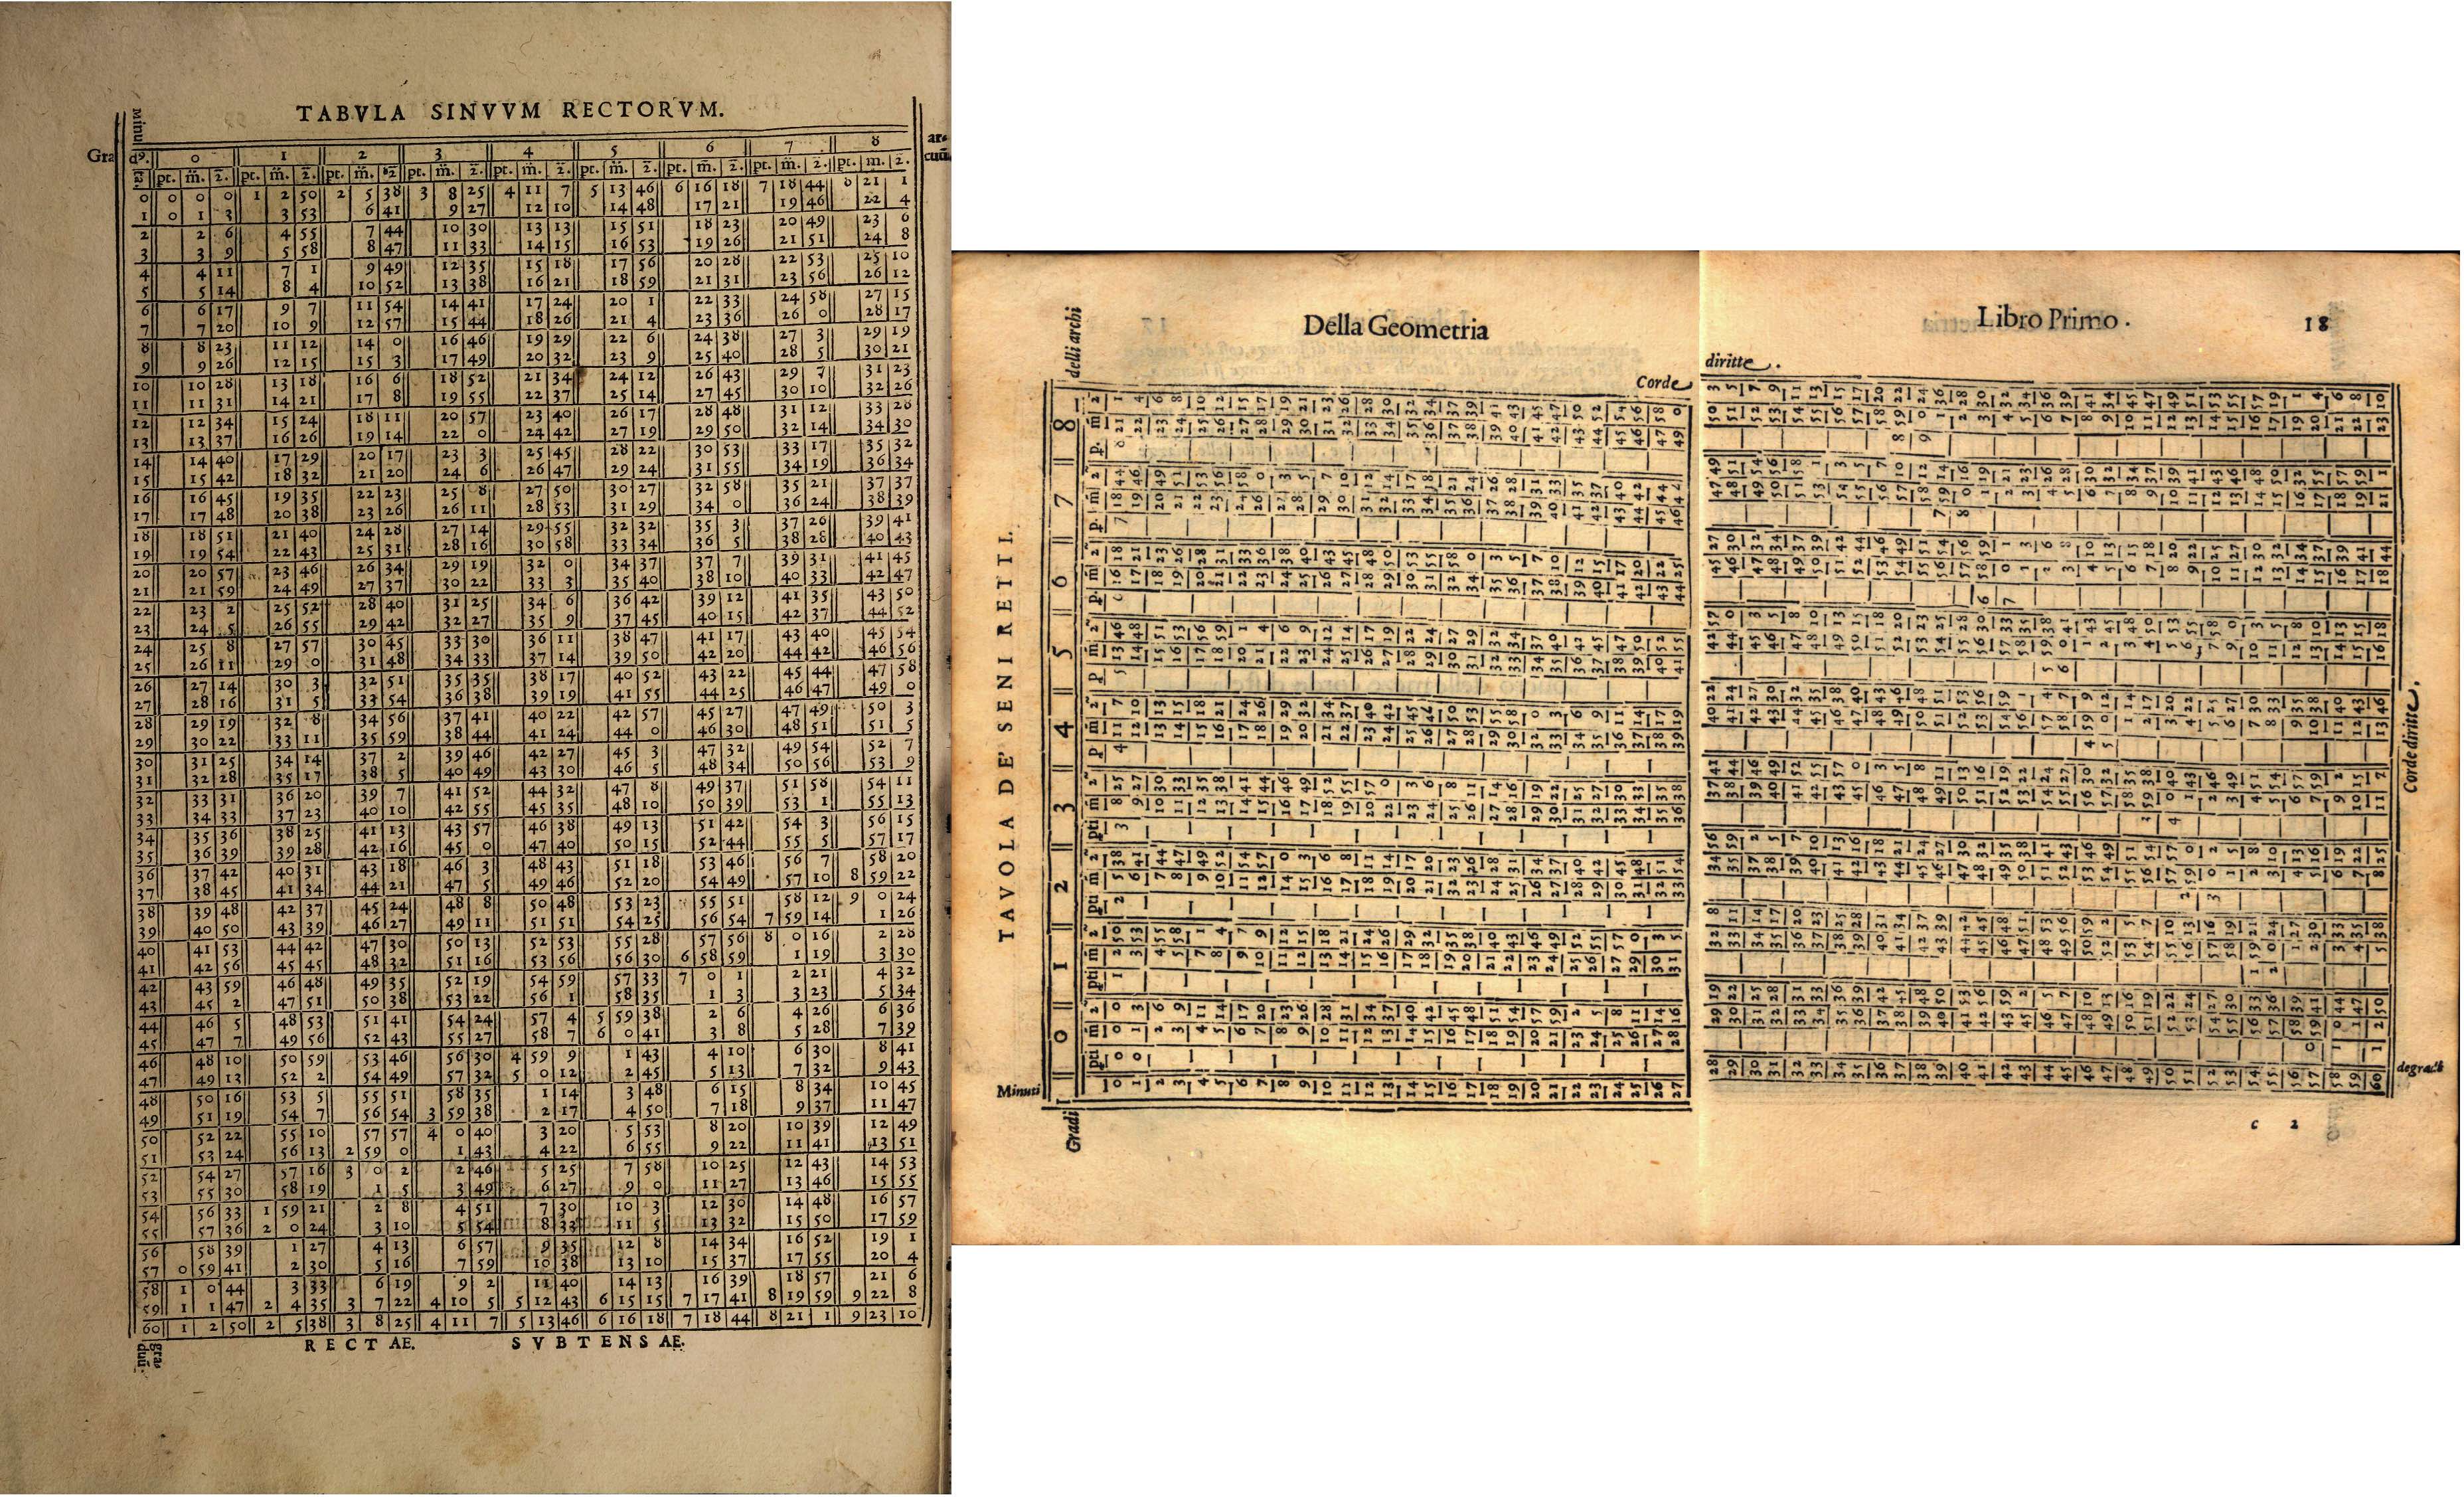
Since antiquity, and especially during the late Middle Ages and the early modern period, the mathematical aspects of astronomy were represented in the form of numerical tables. A computational astronomical table can be understood as an expression of a modern mathematical formula, with columns displaying input values and corresponding output values. Given the significance of astronomy in the education, culture, and daily life of these epochs, the quantity of tables available for historical investigation is vast. However, the high heterogeneity of how the "same table" could be conceived, calculated, and presented complicates the investigation of these fundamental resources, rendering it, at scale, often practically impossible.
“Analysis of historical data at large presents very unique challenges from a Machine Learning perspective, because of the extensive heterogeneity and sparseness regarding data and labels”, explains Prof. Klaus-Robert Müller, BIFOLD Co-Director and Chair of the Machine Learning group at TU Berlin. “We developed the atomization-recomposition method that leverages compositional structure to achieve learning in low-resource settings, enabling an unsupervised machine learning analysis supported by explainable AI techniques.”

Two specific case studies were developed
In their approach, an initial atomization breaks down the composition of numerical features into their basic components, e.g. the task of detecting the number ‘15’ is decomposed into detecting digits ‘1’ and ‘5’ respectively. From a machine learning perspective, this approach helps to efficiently model the high variety in layouts, fonts, and styles, while requiring fewer labeled annotations. A subsequent recomposition step provides the possibility to include expert knowledge and design relevant features necessary to solve the final task. For the table pages in the Sacrobosco Collection, this resulted in interpretable bigram feature maps that highlight the presence of specific bigrams, such as ‘15’, which aids in representing more complex numbers like ‘1547’. Detecting often hundreds of these bigram features results in a numerical fingerprint for each page, enabling the retrieval of semantically similar content from other publications. “Our machine learning-based approach deepens our understanding by grounding insights in historical context, integrating with traditional methodologies like close reading”, explains BIFOLD researcher and first author Dr. Oliver Eberle.
Following this procedure, two specific case studies were developed. The first examines the division of what was considered the habitable zones of the planetary surface into climate zones. Since antiquity, the world has been divided into habitable and inhabitable areas, with inhospitable regions deemed unfit for life due to harsh conditions. The habitable zones, primarily spanning Europe and North Africa, were traditionally divided into seven climate zones based on the length of the solar day on the summer solstice—a concept taught until at least the mid-17th century and fundamental to various knowledge areas, including medicine, astronomy, and geography. This is reflected in the sources under consideration, which contain numerous tables displaying the geographic coordinates that determine the seven climate zones. However, through the clustering process, more similar yet distinct tables of climate zones were identified, particularly those that historians already recognized, which report 24 climate zones and those displaying 7+2 climate zones. The latter type of table was generated within the educational framework of Reformed Wittenberg and is interpreted as a means to include this part of Europe within the habitable zone, as the latitude of the upper seventh zone did not encompass it.
Geo-temporal spread of the table displaying seven climate zones.
Geo-temporal spread of the table displaying nine climate zones.
Geo-temporal spread of the table displaying twenty-four climate zones.
The rise of science as a key aspect of Europe’s cultural identity
Most importantly, the comparative analysis of the sources demonstrates that the age of the Journeys of Exploration—often considered a period of revolutionary change in the conception of the planet—did not dismiss the concept of climate zones; instead, it expanded and reinforced it, employing the older framework to innovate and extend its geographic relevance. This transformation validated European scientific efforts, contributing to the rise of science as a key aspect of Europe’s cultural identity.
The second case study focuses on what we refer to as the Sun-Zodiac tables, which display the values necessary to determine the position of the Sun over the Zodiac throughout the year. This study revealed that the success and spread of these tables were also influenced by the existence of a similar table that presents the Sun's position over the Zodiac but is back-calculated for ancient times, using the cities of Alexandria and Rome as geographical reference points—cultural centers linked to classical Greek and Latin literature. These tables were utilized to calculate the exact dates of ancient events, allowing for the compilation of chronicles. As Melanchthon explicitly stated, without astronomy, human history would be chaotic. Classical works often dated described events by indicating which stars were visible at sunrise or sunset, which in turn depended on the Sun’s position over the Zodiac. The mathematical workflow for calculating dates backward from such initial information was highly complex. Consequently, tables with pre-calculated Sun positions for ancient times were introduced to simplify students’ tasks.
Geo-temporal spread of the 16th century table displaying the contemporary (nostro) Sun-Zodiac table.
Geo-temporal spread of the table displaying the Sun-Zodiac table valid for the ancient writers (veterum).
The early modern European interest in reconstructing ancient chronicles through astronomy underscores the desire for a mathematically precise approach that minimizes interpretation and fosters consensus. This process, initially driven by Wittenberg's textbooks and reformers like Philipp Melanchthon, spread across Europe, transforming the calculation of chronicle dates into a shared scientific practice and reinforcing science as a key element of European cultural identity.
Publication: DOI: 10.1126/sciadv.adj171
More publications: sphaera.mpiwg-berlin.mpg.de/publications/
Project: sphaera.mpiwg-berlin.mpg.de
Database: db.sphaera.mpiwg-berlin.mpg.de/resource/Start
Media coverage:


